Designing for Behavioral Change
PROJECT TYPE | Healthcare System
TIMELINE | June2023 – December 2024
ROLE | Product Manager – UX Researcher/ Designer – UI Designer
TEAM | Fereshteh Shojaei; Fatemeh Shojaei; Pezhman Raeisian; Vrushab Hanumesh; Mark Seidman
TOOLS | Figma; Miro
OVERVIEW
AgileNudge+ is a one of a kind web-based application that redefines behavior change by using Agile science and Nudge strategies. Unlike conventional journaling and behavior modification solutions, AgileNudge+ adopts a dynamic learning approach with diverse resources, networking groups, and a comprehensive tracking dashboard. This improves user engagement, motivation, and enthusiasm for learning while empowering them to achieve their maximum potential.
PROBLEM STATEMENT
Traditional journaling and behavior modification methods often fail to effectively facilitate behavior change and tracking the progress, leaving individuals without the tools they need to reach their full potential. There is a need for a solution that overcomes these limitations and help users to achieve accurate and lasting change.
RESEARCH
USER GROUP | Professionals working within healthcare systems aiming at exploring innovative solutions for behavior change and personal development.
FOCUS GROUPS | As part of our project, we facilitated several informal focus group sessions with stakeholders and potential users. The primary aim was to delve deeper into their current practices regarding behavior tracking and initiating changes in their routines. Through these sessions, we sought to gain valuable insights into the strategies, tools, and methods they currently employ to monitor and modify their behaviors. These discussions provided us with a comprehensive understanding of their needs, challenges, and preferences, which will inform the development of our solution.
USER INTERVIEW | We conducted interviews with both potential users and stakeholders to gain a comprehensive understanding of their perspectives, needs, and expectations. By engaging with both sides, we sought to uncover their perceived requirements as well as the underlying needs driving their behaviors. Through these interviews, we aimed to elucidate not only what they believe they need but also what they truly require to effectively track their behaviors and initiate meaningful lifestyle changes.
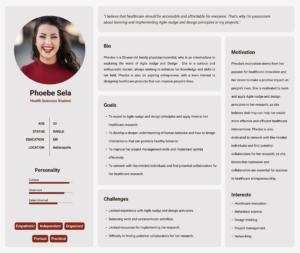
USER PERSONA | After synthesizing the qualitative data gathered from focus groups and interview, our team created the persona for this project. Phoebe, a 33-year-old family physician and scientist, seeks to integrate Agile science into her profession to drive behavioral changes. Her persona was created from real-world insights, reflecting her goals and challenges related to Agile science or those that can be addressed using Agile Science principles.
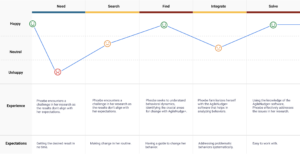
USER JOURNEY MAP |After crafting Phoebe’s persona, a detailed user journey map was constructed to visualize her interactions with the current product(s) throughout various stages. This map delineates key touchpoints and highlights areas where additional user research is imperative to optimize the overall user experience. The process of creating Phoebe’s user journey map commenced with extensive discussions with stakeholders and potential users to elucidate their objectives and pain points concerning the prevailing Agile innovation, implementation, and diffusion protocols established by Indiana University School of Medicine’s Center for Health Innovation and Implementation Science (CHIIS) scientists. Phoebe’s journey map traces her initial aspirations within healthcare research, her navigation through obstacles, her exploration of Agile science principles, her integration of software tools, and ultimately, her journey towards transformative success.
CONCEPT GENERATION
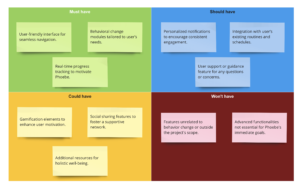
MoSCoW METHOD | In the user-centered design methodology adopted for our project, prioritizing end users’ needs, objectives, and satisfaction was paramount, ensuring ease of comprehension and task completion. To effectively address these considerations, we implemented the MoSCoW method for the persona. Requirements were categorized into ‘Must have,’ ‘Should have,’ ‘Could have,’ and ‘Would have/Won’t have’ categories. ‘Must-have’ requirements are pivotal for meeting business needs and ensuring project success. ‘Should have’ requirements are desirable but not pivotal, while ‘Could have’ requirements are regarded as advantageous features. ‘Would have/Won’t have’ requirements are addressed based on varying priorities and may be deferred to future iterations, with features that we should abstain from incorporating into the project.
ITERATIVE CONCEPT DEVELOPMENT
1ST ITERATION: FOUNDATIONAL DESIGN | The team engaged in weekly brainstorming and sketch-storming sessions and iterated on design concepts a total of 11 times over a 3-month period. This iterative approach allowed for the exploration of diverse ideas and the refinement of design concepts to align closely with project objectives and user needs, focusing on user engagement and the implementation of behavior tracking. This version was tested with 18 users to assess usability and identify areas for improvement.
2ND ITERATION: AI INTEGRATION TO ENHANCE USABILITY | Based on feedback from the initial testing, we introduced Artificial Intelligence (AI) into the application to improve the search functionality and make it easier for users to find relevant resources. One of the key goals was to reduce the time it took users to complete tasks—from 1.5 hours to 20 minutes. We tested this iteration with 10 healthcare professionals, gathering feedback to refine the AI and optimize the overall user experience.
Key updates included:
- AI-Assisted Problem Statement Generator: Simplified challenge articulation by automatically refining and simplifying user inputs.
- Automated Nudge Search: Eliminated the need for users to sift through extensive libraries of nudges and cognitive biases by using AI to recommend the most relevant nudges based on the user’s problem statement.
- Customizable Stakeholder Mapping: Provided users with the flexibility to edit stakeholder maps, offering both AI-suggested nudges and the option for manual input instead of two separated blueprints.
3RD ITERATION: OPTIMIZING USER EXPERIENCE | The third iteration focused on further refining the features based on the second round of feedback. We enhanced the user interface, integrated more AI-driven functionality to support problem-solving and decision-making, and streamlined the workflow. The third version included a new “Problem Statement Generation” tool, which uses AI to auto-generate problem statements, and a “Demand Index” tool to help users assess the viability of their behavioral change initiatives. Additional features like stakeholder mapping and sprint design were further optimized for user clarity and efficiency.
Key updates included:
- Developed Sprint Management: Introduced a sprint card system for better tracking of progress and efficient task assignment.
- Demand Index Assessment: Enabled users to assess and prioritize problems by evaluating their solvability and potential impact.
- MSOP: Allowed users to track sprint progress and submit successful nudges for approval by the principal investigator before sharing with the community.
- Tutorials and Resources: Added comprehensive tutorials and resource materials to guide users through the software’s features and increase their knowledge of the nudge design process.
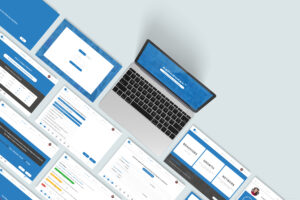
WIREFRAMING & PROTOTYPING
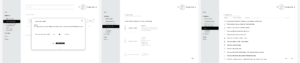
Following the initial research and design phases, mid-fidelity and high-fidelity MVPs were developed. In the mid-fidelity phase, Figma was employed to create and refine conceptual sketches, resulting in an interactive prototype of AgileNudge+. This phase facilitated clarity in design concept, user expectation alignment, and initial stakeholder and user testing for optimal usability. Transitioning to high-fidelity MVPs involved a collaborative effort with developers, spanning seven week-long sprints for iterative testing cycles of AgileNudge+.
DESIGN
HOMEPAGE | The final concept of AgileNudge+ V 1.0 featuring three primary modules: Behaviors, Growth, and Network upon sign-in or initial registration on AgileNudge+. Additionally, a “Highlights” section offers updates and insights from CHIIS. In the Behaviors section, users initiate a transformative journey through a two-step process: Nudge and Sprint. This section facilitates behavior documentation, stakeholder identification, nudge creation, and success planning. The Growth section allows users to access resources, develop skills, and participate in CHIIS events. Meanwhile, the Network section encourages users to engage in group activities, share ideas, and find community support.
During the specified timeline, the project focuses solely on developing the Behaviors section, emphasizing key features and steps as follows:
MAPPING THE JOURNEY | AgileNudge+ provides a visual map for tracking current and ideal behavior, stakeholders, nudges, and interconnections. This map aids in recalling elements post-mission completion.
BLUEPRINTS | Users receive concise summaries of nudge and sprint missions upon completion, available for future reference or sharing.
GAMIFIED FEATURES | A scoring system enhances engagement, with users earning points for completing missions. A dynamic point bar visually tracks progress, with a maximum cumulative score of 100 points, offering a visual representation of the user’s score throughout the behavioral change journey.
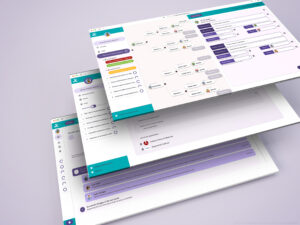
The AgileNudge+ V3.0 interface introduces an enhanced user journey with five primary modules: Problem Statement, Demand Index, Stakeholder Mapping, Nudge Design, and Sprint Monitor, accessible upon sign-in or initial registration. Additionally, the “Highlights” section provides updates, insights, and tutorials to support user engagement. V3.0 emphasizes a streamlined workflow, allowing users to move through each step with AI-guided assistance and customizable features.
PROBLEM STATEMENT GENERATION | AgileNudge+ V3.0 enables users to define challenges clearly and concisely with the help of AI. By clicking “Generate Problem Statement,” users input detailed descriptions of their challenges, which the AI condenses into an actionable problem statement. This feature includes:
- Editable fields for refining the problem statement.
- An iterative revision process to ensure clarity.
- Seamless transition to the Demand Index module.
DEMAND INDEX | To quantify the importance of addressing the identified problem, the Demand Index evaluates weighted criteria such as:
- Executive support.
- Service line engagement.
- Clinical relevance.
- Strength of supporting evidence.
- Impact on the Quadruple Aim.
- Scalability potential.
Users can input data through questionnaires, meetings, or directives, with a score of 80 or higher signaling a “GO.” This tool supports decision-making by recommending either continuing to the next step or reallocating resources based on demand.
STAKEHOLDER MAPPING | AgileNudge+ V3.0 offers an interactive visual map of stakeholders, problem behaviors, and associated nudge types. Features include:
- Editable nodes for customizing AI recommendations.
- A search library for evidence-based nudges categorized by behavior, target, or type.
- Manual entry options for bespoke behavior tracking.
NUDGE DESIGN | Users can design targeted interventions through sprints, assigning sprinters to each nudge. Key capabilities include:
- Assigning roles via dropdown menus or external invites.
- Setting success and termination measures.
- Using variable metrics for precise tracking.
- Emphasizing quick adaptation by “failing fast” when goals are not met.
SPRINT MONITOR | The Sprint Monitor facilitates real-time tracking of progress through an observation chart. Features:
- Dichotomous or continuous variable tracking.
- Alerts for success or termination conditions.
- Detailed reporting via a printable MSOP (Map of Stakeholders, Objectives, and Progress).
OTHER FEATURES |
- Profile Management: Users can customize avatars, update profiles, and access their personal dashboards.
- Tutorials and Resources: Video tutorials, a comprehensive nudge library, and practical guides ensure ease of use and skill-building.
THINGS I LEARNED
- Collaborating with a diverse team of stakeholders, developers, and end-users provided invaluable insights into their perspectives and thought processes. Working closely with users allowed for a deeper understanding of their envisioned behaviors and needs.
- Engaging with professionals such as MDs initially presented challenges in eliciting insights due to hesitancy. We adapted our approach by leveraging trusted connections, attending relevant meetings, and establishing rapport to foster trust and facilitate open communication.
- Throughout the interviews, we learned to prioritize and address critical issues while balancing the team’s objectives and user requirements effectively. This experience underscored the importance of scoping and problem-solving in a collaborative setting.
- Managing a geographically dispersed team across various cities in the US posed coordination challenges during remote work. Despite this, the project provided valuable lessons in navigating diverse expertise levels, enhancing remote collaboration skills, and conducting effective usability testing sessions remotely.